

FlightBI Enhances ZIP-OD Platform to Improve Airport Catchment Analysis for Air Service Development Teams
 Credit: FlightBI, Fligence ZIP-OD
- Built for airport planners who need accurate catchment intelligence. - Empowering ASD teams with clearer passenger origin data.
McLean, VA — December 1st, 2025 — FlightBI today announced two major upgrades to its Fligence ZIP-OD catchment analysis platform, making it even more valuable for airport Air Service Development (ASD) teams seeking accurate passenger distribution, market insights, and demand modeling.
More Accurate Catchment Data for Route Planning
Fligence ZIP-OD’s historical catchment data has been refreshed using an improved methodology from Fligence’s air mobility data provider. The updated approach adjusts for varying mobile-device capture rates, producing a more accurate distribution of true market demand across ZIP codes.
Example:
- Previous data showed 110 vs. 90 captured visitors from area A and area B.
- After adjusting for capture rates of 11% and 9%, respectively, each area contributes ~1000 true visitors.
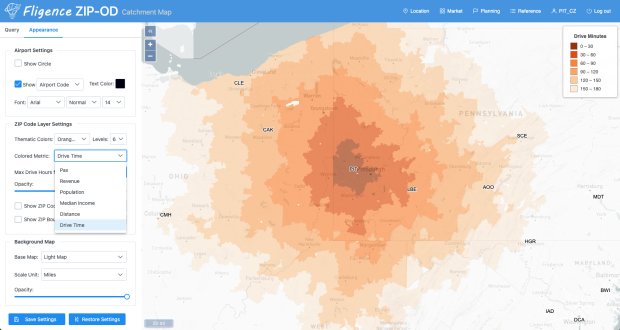
New Choropleth Maps for Visual Catchment Insights
Fligence ZIP-OD now includes expanded Choropleth maps that display multiple metrics essential for ASD decision-making, including:
- Passenger volume (Pax)
- Revenue
- Population & Median Income
- Drive time & Distance
- Pax Density, Revenue Density & Population Density
These visualizations make it easier for airports to analyze catchment patterns, identify growth opportunities, and support route proposals with data-driven evidence.
A Powerful Tool for Airport Market Analysis
“These upgrades strengthen ZIP-OD as one of the most accurate and user-friendly catchment analysis tools available to airports,” said Clement Zhang, founder of FlightBI. “ASD teams can now see a clearer, more reliable picture of passenger behavior and market potential.”
Airports interested in improving their catchment understanding or supporting route development efforts can learn more at flightbi.com.