

Global hubs expand again, but demand will decide the winners

Global airport seat capacity has become an increasingly important reference point for understanding how the aviation industry is evolving, particularly in periods of uneven demand and structural change.
Unlike passenger statistics, capacity reflects forward-looking decisions by airlines and airports, shaped by expectations around growth, competition, infrastructure limits and operating economics.
The world's largest airports continue to be dominated by a relatively small group of mega hubs, yet the similarities largely end there.
Differences in domestic versus international reliance, hub-and-spoke intensity, airline concentration and low-cost penetration result in widely varied outcomes from superficially comparable levels of capacity.
Infrastructure design also plays a decisive role, with runway availability, operating hours and aircraft mix often proving more influential than terminal size alone.
Recent years have underscored how capacity can expand or contract independently of underlying demand, influenced by fleet availability, regulatory constraints and geopolitical factors. As a result, headline capacity rankings provide only partial insight into performance or resilience.
Understanding how and where capacity is being deployed therefore offers a useful framework for assessing strategic intent across the industry.
However, it also highlights the limits of capacity as a standalone metric, reinforcing the need to interpret it alongside utilisation, yield and long-term sustainability when assessing the true health of global aviation.
OAG's annual review of seat capacity by airport, in this case for 2025, reveals the usual suspects heading the Top 10 list - the 'Mega hubs', that handle a hefty percentage of the world's air travellers, and especially those in transit. This report is based on the original OAG report together with CAPA - Centre for Aviation's observations on it.
Summary
- Atlanta Hartsfield-Jackson International Airport remains the world's busiest airport by seat capacity in 2025, but Dubai International is rapidly closing the gap with a 16% increase over 2019 levels.
- Istanbul Airport and Chicago O'Hare recorded the strongest seat capacity growth among the global top 10, with Istanbul targeting a 200 million passenger capacity by 2030.
- Tokyo Haneda and London Heathrow maintain high rankings, with Haneda planning major expansions and Heathrow moving forward with its long-delayed third runway project.
- The top 10 busiest airports reflect the dominance of large domestic markets in the US and China, as well as the sustained growth of Middle Eastern and emerging hub airports.
- There is a notable disparity in runway numbers among the top airports, with some of the largest by capacity operating with only two runways due to unique operational circumstances.
- Actual passenger numbers, not just seat capacity, will ultimately determine the success of these airports, making future passenger data releases crucial for assessing market performance.
The importance of airport capacities and what they say about business models
At this time of year it is incumbent among providers of digital flight information, like OAG, to report on what were the world's busiest airports by capacity for 2025.
This measure is not the same as 'passengers handled'. In some cases those statistics are released early, and are even available already. In others, it may take weeks or months, and if a small number they are never released at all, for a variety of reasons.
With capacity the figures are already known - the type of aircraft allocated to a route, its frequency of operation and the number of seats it offers.
That capacity is used to varying degrees, of course.
In simpler times, before the advent of 'low cost' travel in the western hemisphere when fares were bundled with services and limited in scope (often as few as three fare types for each flight), an all-economy aircraft configuration would be expected to break even at a load factor of 66% - two thirds of capacity. Anything beyond that would be profit, when all direct and indirect costs were accounted for.
It was quite simple, really.
Today, with so many models - low cost, ultra-low cost, hybrid, full service, business, regional - such break-even factors can vary immensely, theoretically from 50% to 95% - although no airlines would be in business at the latter end of that scale.
So it is always useful to know airport capacities before passenger data being released, as a comparison between the two can give insights as to the traffic mix and how successful it is for an airport.
The Top 10 airports list for 2025 is again headed by Atlanta
The chart below shows the Top 10 airports in the world by seat capacity in 2025 (international and domestic seats).
After follows CAPA - Centre for Aviation's own insights into each of these airports using data for the week commencing 09-Feb-2026 to make observations,
Busiest airports of 2025, based on total seat capacity (international + domestic)
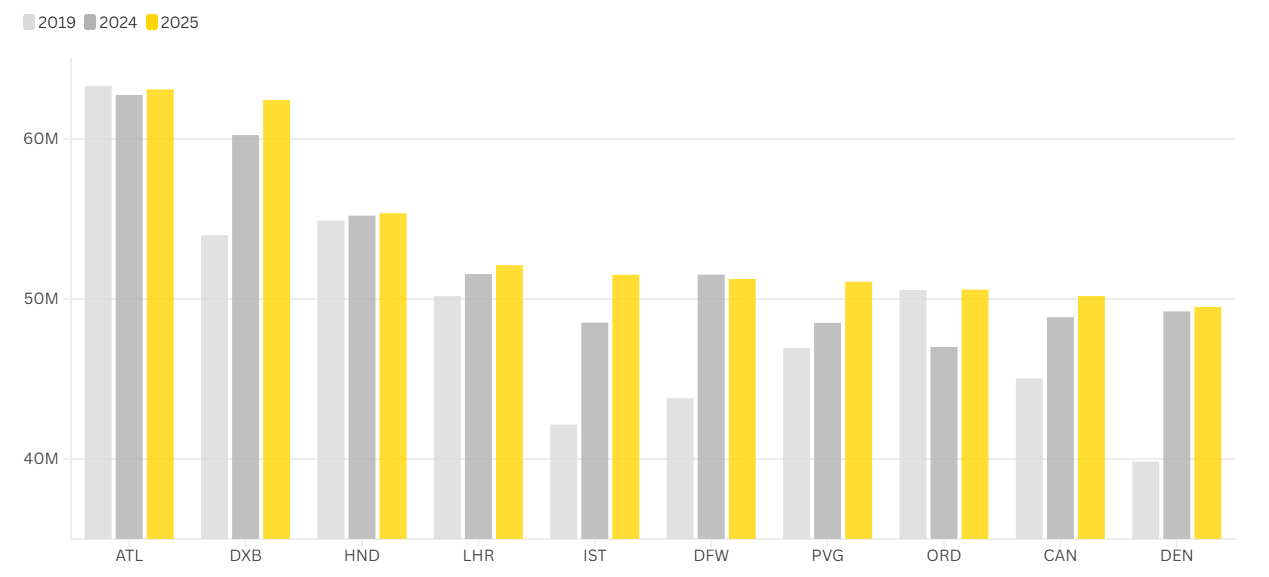
Source: OAG Megahubs 2025 report.
Atlanta Hartsfield-Jackson International retains its position as the world's busiest airport
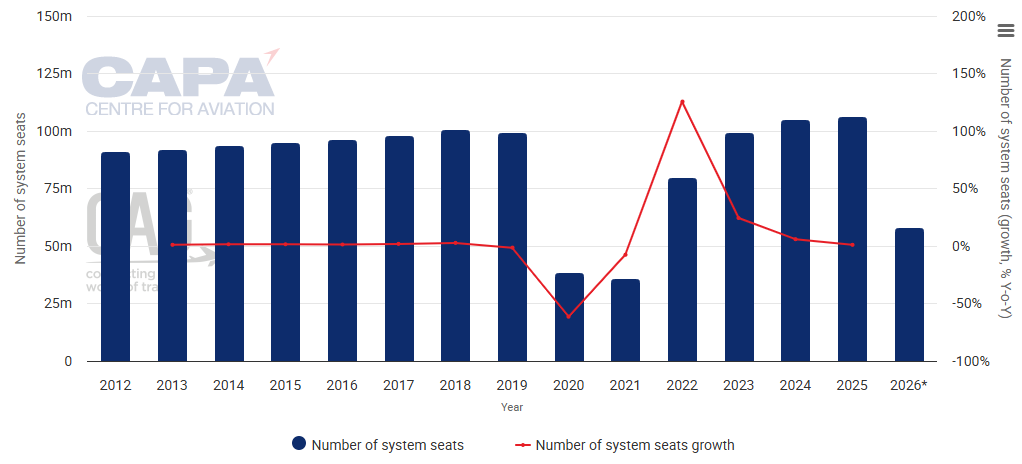
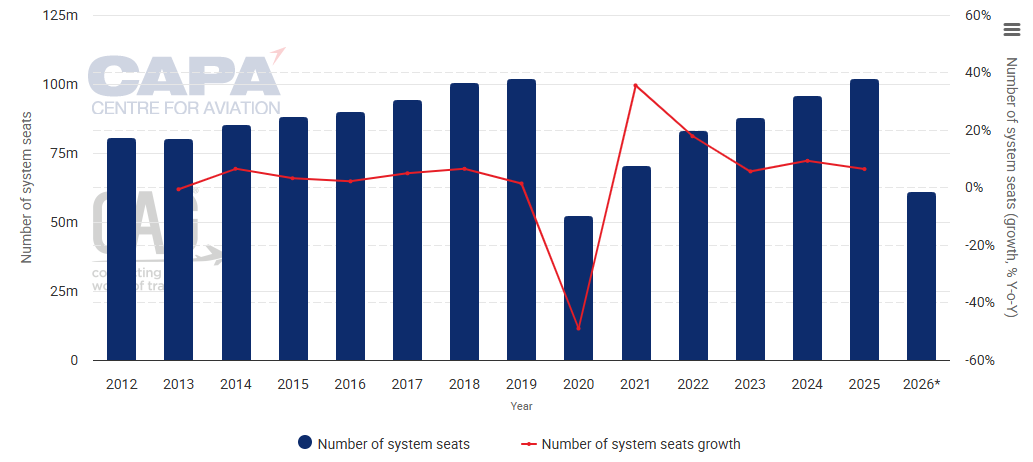
In 2025 Atlanta Hartsfield-Jackson International Airport (ATL) retained its position as the world's busiest airport, offering 63.1 million seats across domestic and international services. (Note that seat capacities in OAG data are shown on a one-way basis, whereas in CAPA - Centre for Aviation data they are both departure and arrival, so CAPA - Centre for Aviation shows 125.05 million seats registered for 2025.)
Capacity increased 1% year-on-year in 2025, and is now broadly in line with pre-pandemic levels (2019 was 126.025 million).
Atlanta Hartsfield-Jackson International Airport: annual system seats capacity, from 2012
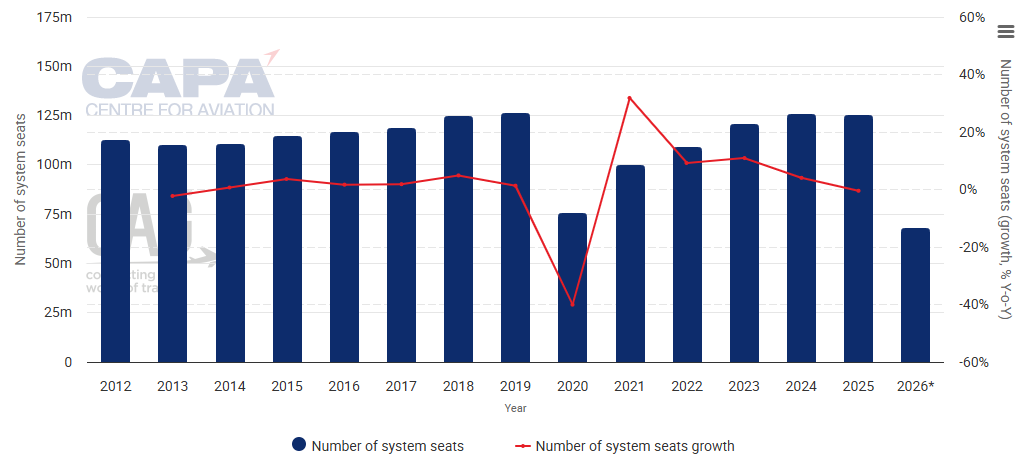
Source: CAPA - Centre for Aviation and OAG.
* The values for this year are at least partly predictive up to 6 months from 09-Feb-2026 and may be subject to change.
Delta Air Lines remains by far the biggest airline at Atlanta, with 77.3% of capacity in the week commencing 09-Feb-2026.
For that week, 97% of capacity is on US-based airlines and 84.8%, of it is on full service carriers.
SkyTeam is the largest alliance, with 78.7% of capacity.
Dubai International closed the gap, with capacity up 16% over 2019 levels
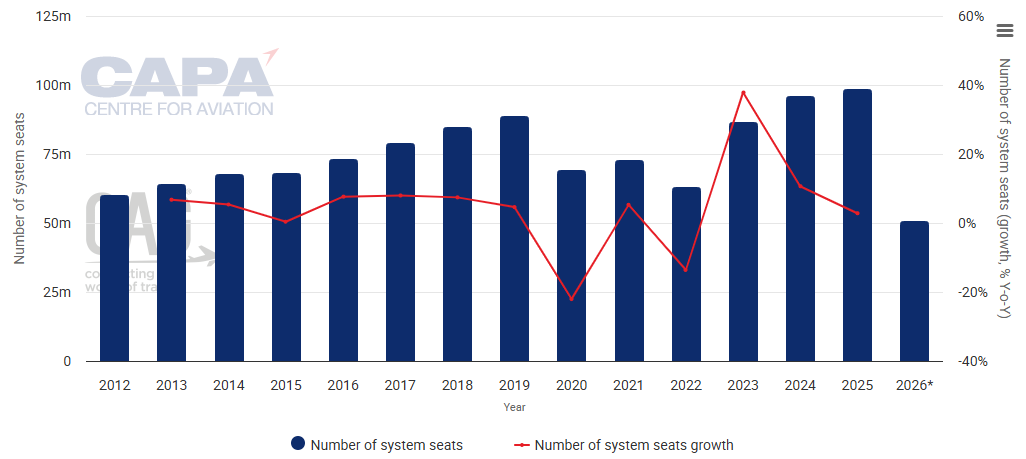
Dubai International Airport (DXB) ranked second, with 62.4 million seats. Capacity increased by 4% and is 16% above 2019 levels - a much larger margin than at Atlanta.
However, 2019 had been -8% compared to 2018 because of a runway closure for refurbishment, the grounding of Boeing 737 MAX aircraft, and the collapse of Jet Airways in India.
The CAPA - Centre for Aviation data shows that almost 67 million seats are so far recorded for 2026 (up to six months from 02-Feb-2026). As expected, Emirates is the largest airline with 55.2% of seats but that is over 10 percentage points down compared to the same week in 2019.
Dubai International Airport: annual system seats capacity, from 2012
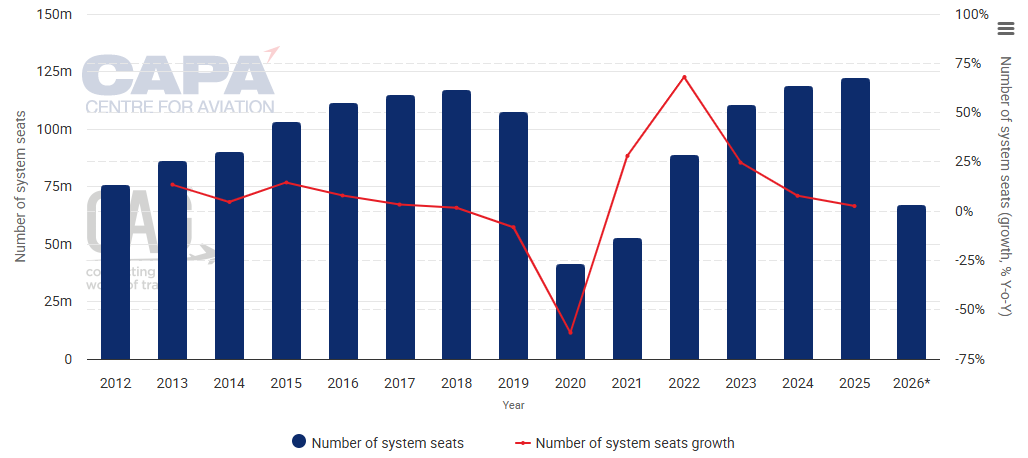
Source: CAPA - Centre for Aviation and OAG.
* The values for this year are at least partly predictive up to 6 months from 09-Feb-2026 and may be subject to change.
Of the capacity, 26.6% is on low cost carriers (LCCs), up from 19% in 2019, and 87.9% of seats are on unaligned airlines (led, of course, by Emirates), which is slightly down on 2019 (90%).
It will be many years yet until Dubai World Central (Al Maktoum) (DWC) opens.
Until then, the actual infrastructure size of DXB is, and will remain, very constrained; but on the other hand, it operates 24/7 and mostly handles large, widebodied aircraft, so has been able to reach this level. The ultimate capacity is believed to be about 115 million mppa, which should be reached around 2031.
And then 2032 is the date when Dubai Airports expects to make the complete transition out of DXB to DWC, which will be opening with an initial capacity of 150mppa and then building up to 260mppa - anticipated to be the case by 2057.
So the next few years will be absolutely crucial to get the last vestiges of capacity out of the DXB system.
Tokyo Haneda holds third place as it targets 100mppa capacity by 2050
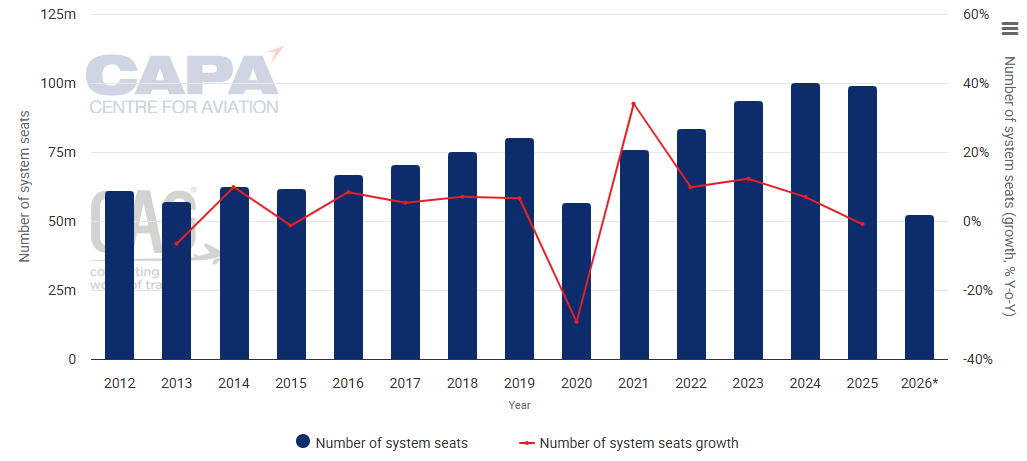
Tokyo Haneda Airport came in third place with 55.4 million seats, maintaining stable capacity levels and remaining slightly above pre-pandemic volumes (+4.6%).
CAPA - Centre for Aviation data has 56.3 million seats so for 2026, reaching out six months from 09-Feb-2026.
Tokyo Haneda Airport: annual system seat capacity, from 2012
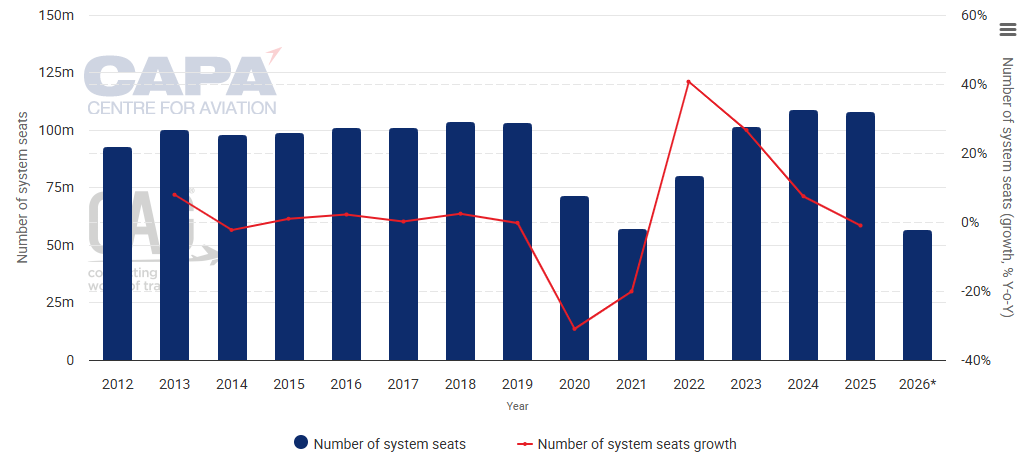
Source: CAPA - Centre for Aviation and OAG.
* The values for this year are at least partly predictive up to 6 months from 09-Feb-2026 and may be subject to change.
The two largest airlines, by far, are All Nippon Airways (38.8% of capacity) and Japan Airlines (32.8%).
There is a total of 86.0% of seats that are on Japanese airlines.
Over 90% (90.8%) of capacity is on full service carriers; supporting the theory that low cost is still yet to make its mark fully in Japan, where the budget seat ratio is creeping up to 30% overall (but not at the country's main gateway - there is a greater share, 45.7%, at Tokyo Narita Airport).
All three of the main airline alliances are present, the largest being Star Alliance (43.9%).
Haneda is undergoing significant, ongoing expansion to increase its capacity, with major projects, including a new Terminal 1 satellite, scheduled for completion in summer 2026 to accommodate growing international traffic and improve connectivity. These efforts are part of a broader, multi-phase plan targeting a 100 million passenger capacity by 2050.
'Full service' London Heathrow gears up for third runway expansion at last
London Heathrow Airport ranked fourth, with 52.1 million passengers, which was 0.6 million ahead of 2024 and two million ahead of 2019, having been severely impacted by the COVID-19 pandemic by government indecision.
Along with Istanbul (#5), they are the only two ranked European airports in the Top 10.
CAPA - Centre for Aviation data for 2025 shows 105.7 million departing and arriving seats and has the total number of seats for 2026 (up to six months from 09-Feb-2026) at 57.7 million, which is 20 million more than it was for the whole of 2021.
London Heathrow Airport: annual system seats capacity, from 2012
Source: CAPA - Centre for Aviation and OAG.
* The values for this year are at least partly predictive up to 6 months from 09-Feb-2026 and may be subject to change.
British Airways is the leading airline, with 46.3% of capacity, which is exactly the same as it was in the same week of 2019.
Some things never change.
Domestic seats, including feed to international routes, form a small part of the total at Heathrow (only 6.3%), which is a problem that could be solved by the third runway - if, and when, it is finally built.
Likewise regional and low cost seats are sparse at what is possibly the world's most focused full service airport, accounting for only 3.8% of the total between them, while airline alliances, led by oneworld, collectively account for 87.4% of seats.
Heathrow is moving forward, at last, with plans for a third runway, with the government backing a GBP33-49 billion expansion scheme; the most expensive in the world. In early 2026 the board approved new investment to advance the planning application, aiming to secure planning permission by 2029 and have the new runway operational by 2035.
Istanbul Airport continues to mount a challenge towards Dubai with anticipated 200mppa capacity by 2030
Istanbul Airport has increasingly been setting out its stall to challenge the Middle East airports, including Dubai International, as well as the 'old world' European airports.
In 2025 seat capacity there was exactly the same as what it had been at London Heathrow in 2024: 51.5 million. At the rate of increase in 2025 (+6.25%) compared to that of Heathrow (+1%), it looks as if Istanbul might possibly overhaul London Heathrow in 2026.
So far in 2026 there are 56.2 million departing and arriving seats in the inventory (as at 09-Feb-2026).
Istanbul Airport: annual system seats capacity, from 2018
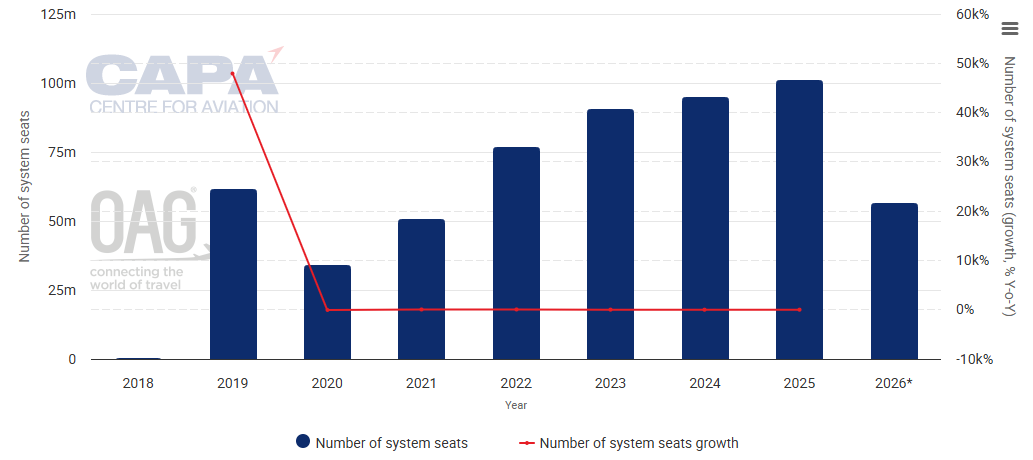
Source: CAPA - Centre for Aviation and OAG.
* The values for this year are at least partly predictive up to 6 months from 26-Jan-2026 and may be subject to change.
Istanbul is another primary base and hub airport dominated by a single airline - namely Turkish Airlines, which right now has a massive 81.8% of capacity, over eight percentage points greater than the combined Emirates and flydubai total at Dubai.
Furthermore, 95.3% of capacity is on full service carriers, and just 3.6% on LCCs.
Star Alliance is the predominant alliance, with 84.1% of capacity.
The airport, which only opened late in 2018, is currently undergoing a massive, multi-stage expansion designed to make it the world's largest, with capacity aimed to hit 200 million passengers annually by 2030 (two years before Dubai World Central will be fully open). Major upgrades, including new runways and smart cargo facilities, are scheduled through 2028.
Dallas Fort Worth capacity showed slight decline in 2025, but still well in advance of 2019 figure
Dallas Fort Worth International Airport entered the list of the world's busiest airports during the COVID-19 pandemic largely because of the sustained domestic connections its hub provided. Of its capacity, 84.1% is on domestic services. The airport was not badly affected by the COVID-19 pandemic compared to some of its peers.
In 2025 the number of seats actually declined slightly (-2%), from 51.5 million to 51.25 million, but Dallas Fort Worth remained well in advance of the 2019 figure. So far in 2026, 55.4 million departure and arrival seats have been added.
Dallas Fort Worth International Airport: annual system seats capacity, from 2012
Source: CAPA - Centre for Aviation and OAG.
* The values for this year are at least partly predictive up to 6 months from 09-Feb-2026 and may be subject to change.
American Airlines, for which Dallas Fort Worth has long been a major hub, is the main airline, with 82.3% seat capacity. Because of its membership of the oneworld alliance - that is the main explanation for why 85.0% of capacity is on that alliance.
Low cost has a limited presence, accounting for only 7.0% of seats.
Significant infrastructure development is under way at Dallas Fort Worth - most notably at the USD4 billion Terminal F project, featuring 31 new gates and expected to open in 2027. Additional projects include the Terminal C renovation, a USD3 billion overhaul of its busiest terminal, and improvements to roadways, including a new bridge for Terminal C access.
Shanghai Pudong is now China's leading airport
Shanghai Pudong International Airport, serving China's main commercial city, is one of two from that country; but Beijing Capital, the only airport apart from Atlanta ever to have handled in excess of 100mppa, is nowhere to be seen, having struggled to recover from the pandemic.
In 2025 Pudong added 2.5 million seats compared to the previous year (+4.3%).
In 2026, so far, there are 50.6 million departure and arrival seats.
Shanghai Pudong International Airport: annual system seats capacity, from 2012
Source: CAPA - Centre for Aviation and OAG.
* The values for this year are at least partly predictive up to 6 months from 09-Feb-2026 and may be subject to change.
Domestic seats predominate, at 56.2% of the total.
China Eastern Airlines is the largest carrier, with 32.5% of the total, and capacity is more equally split between airlines than it is at most other airports in the Top 10 list.
But the low cost presence is slight, with just 12.4% of the capacity.
All the main alliances are represented.
Significant new infrastructure is being built. The airport is initiating its Phase 4 expansion, which includes constructing a major new 852,600sqm Terminal 3, an integrated transportation centre, multi-storey car parks, and supporting infrastructure to boost capacity.
Chicago O'Hare looks to another year of strong growth
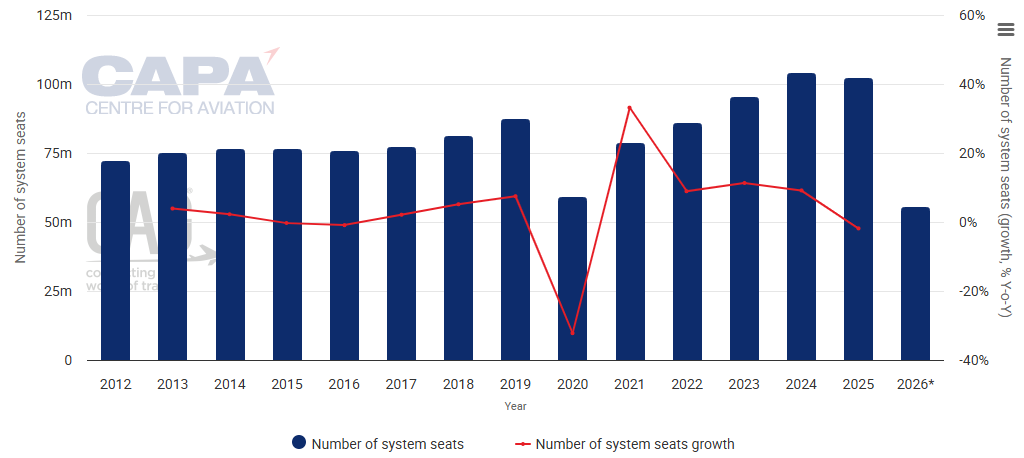
Chicago O'Hare International Airport finished 2025 with 50.6 million seats: the same as in 2019, and a 7.6% increase over 2024.
So far in 2026 there are 60.8 million seats in the inventory of departure and arrival seats, well over one half of the 2025 total, which is unusual, and which portends another year of strong growth.
Chicago O'Hare International Airport: annual system seat capacity, from 2012
Source: CAPA - Centre for Aviation and OAG.
* The values for this year are at least partly predictive up to 6 months from 09-Feb-2026 and may be subject to change.
One of the main reasons for O'Hare's significance - apart from the fact that Chicago is a highly important commercial and industrial city - is that it stands at a surface travel crossroads, as well as being an air hub. That hub is a constant battleground between the airlines American Airlines and United Airlines, which respectively have 34.9% and 47.4% of the capacity in the analysis week.
As a result, 91.7% of capacity is on aligned airlines, while the low cost segment accounts for only 6.9% of the total.
Numerous investment projects are under way at O'Hare, such as Concourse D (to be operational by 2028), the future Concourse E, the replacement of Terminal 2 with the new Global Terminal (2032), and supporting infrastructure.
These projects are part of a broader USD8.2 billion Terminal Area Plan aimed at transforming O'Hare into a "world-class aviation hub".
Guangzhou Airport keeps its place in the Top 10 as it boosts capacity to 120mppa
Guangzhou Baiyun International Airport is the second Chinese airport in the Top 10 list.
Baiyun came out of nowhere to become the world's busiest airport by passenger numbers in 2020, but has since dropped back down the rankings.
The number of seats there grew from 48.9 million to 50.2 million between 2024 and 2025, which is an increase of 2.7%.
So far in 2026, 50.5 million departing and arriving seats have been added.
Guangzhou Baiyun International Airport: annual system seats capacity, from 2012
Source: CAPA - Centre for Aviation and OAG.
* The values for this year are at least partly predictive up to 6 months from 26-Jan-2026 and may be subject to change.
Domestic travel accounts for more than three quarters (76.6%) of the seat capacity.
Domestic air travel in China has largely returned to normal following the COVID-19 pandemic, and even exceeded pre-pandemic levels, though international travel recovery is still continuing.
China Southern Airlines is the largest airline, with 48.1% of capacity.
The main alliances are represented at Baiyun, but not to the same degree as at Shanghai Pudong. Of the capacity, 71.2% is on unaligned airlines - almost twice the total at Shanghai Pudong.
But Baiyun has a similarly low level of low cost capacity, at 10.0%.
Baiyun is undergoing a massive phase 3 expansion, highlighted by the opening of a new, highly advanced Terminal 3 and an associated transportation hub in Oct-2025. This, along with future T1 renovations, will boost capacity to 120 million passengers annually, solidifying its role as a key hub.
Denver's capacity belies its standing as only the 19th most populous US city
Denver International Airport is the fourth US airport in the Top 10, and along with Dallas Fort Worth is not in what are considered as major cities (they are the 9th and 19th most populous, according to 2024 estimates), but both are major hub airports, especially for domestic travel. The status of both benefitted during the COVID-19 pandemic.
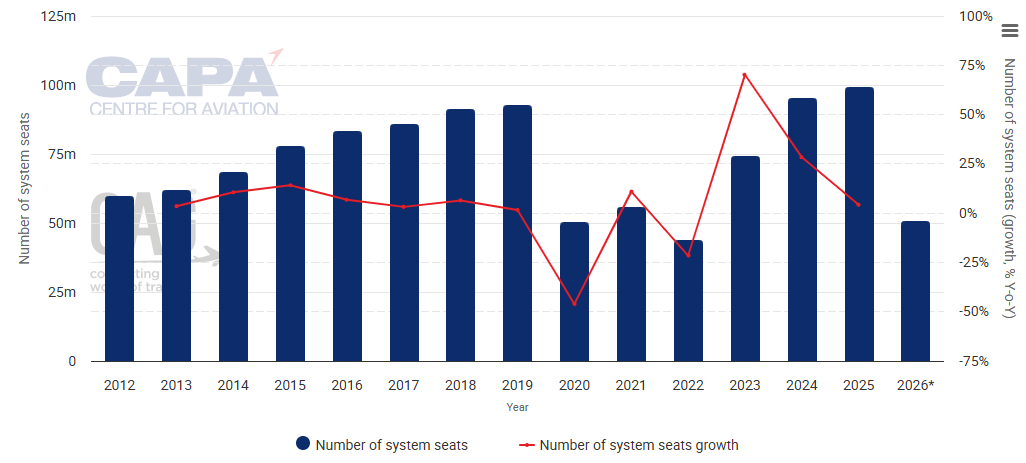
Although Dallas Fort Worth slipped slightly in 2025 (the only one in the Top 10 to do so), Denver increased capacity by 0.7%, to 49.5 million.
So far in 2026, 52.1 million departing and arriving seats are in the inventory.
Denver International Airport: annual system seats capacity, from 2012
Source: CAPA - Centre for Aviation and OAG.
* The values for this year are at least partly predictive up to 6 months from 09-Feb-2026 and may be subject to change.
There is a very high proportion of domestic seats (94.4%).
United Airlines, which has a major base/hub there, has 50.3% of capacity, and Southwest Airlines has 29.9%.
The presence of Southwest ensures a higher-than-average low cost capacity ratio of 39.8%, while Star Alliance dominates the alliances that operate there, with 51.2% of capacity.
Denver International is undergoing very large scale, ongoing infrastructure expansion, including the USD2.1 billion Great Hall Programme (modernising the Jeppesen Terminal, a public-private project that became a public one in 2019), a USD2.5 billion gate expansion programme, and new underground tunnels for de-icing.
These projects aim to support growth from 82 million to 100mppa.
Chicago and Istanbul recorded the strongest capacity growth level, while Dubai closes in on Atlanta
In summary, Chicago O'Hare Airport (+8%) and Istanbul Airport (+6%) recorded the strongest seat capacity growth among the global top 10.
Istanbul Airport remains a standout as one of the fastest growing major hubs, with capacity now 22% higher than in 2019.
Dubai International has closed the gap on its peers.
Four of the world's 10 busiest airports are in North America and three in Asia.
The top 10 busiest airports reflect the strength of large domestic markets in the US and China, sustained growth in the Middle East, and the continued emergence of new hub airports since 2019.
Big variety in the number of runways
It may be worth noting the number of runways at each of these airports. Ultimately capacity is determined by runway space rather than by terminal or other factors, as important as they may be.
The variety in the results is surprising, although local circumstances will always apply. For example, the 24/7 operation of Dubai International and its pre-eminence of infrequent long haul services over regular short haul ones.
|
Airport |
Number of runways |
Maximum length (metres) |
|
5 |
3,776 |
|
|
2 |
4,447 |
|
|
4 |
3,000 |
|
|
2 (3 by 2035??) |
3,902 |
|
|
Istanbul |
5 (6 by 2028) |
4,100 |
|
7 |
4,085 |
|
|
5 |
4,000 |
|
|
Chicago O'Hare |
8 |
3,962 |
|
Guangzhou Baiyun |
2 |
3,800 |
|
6 |
4,877 |
|
|
Average |
4.6 |
3,695 |
Source: CAPA - Centre for Aviation Airport Profiles.
Bums on seats are what matter ultimately
The view of OAG is that global aviation has moved into a new phase of growth, and some elements of this data certainly support that opinion, while alternative arguments could be made from other sources, such as weakening demand in some major tourist markets in 2025 that is only being openly revealed in the first month of 2026.
At the end of the day, the air transport business makes money from actual 'bums on seats', not by the capacity it supplies, and it will be interesting to see the full-year passenger (and cargo) figures as they are announced, to confirm or deny whether the capacity increases were justified in individual markets.
Global hubs expand again, but demand will decide the winners
What this snapshot of 2025 capacity ultimately underlines is that scale alone no longer defines success among the world's largest airports.
The Top 10 remain dominated by mega hubs, yet their strategies, constraints and risk profiles are diverging sharply.
Some, such as Istanbul and Chicago O'Hare, are expanding into favourable competitive positions, while others, notably Dubai International and London Heathrow, are operating close to the practical limits of legacy infrastructure and regulatory tolerance.
The wide variation in runway numbers is especially telling. It highlights how operational design, aircraft mix, hours of operation and hub structure can, for a time, compensate for physical limitations.
However, such advantages are finite. As traffic volumes grow, the margin for disruption narrows and the cost of inefficiency rises disproportionately.
More importantly, capacity growth is increasingly a statement of intent rather than a guarantee of returns.
Airlines today operate across a broad spectrum of cost bases and load factor requirements, making it harder to infer commercial health from seat numbers alone.
The coming comparison between capacity supplied and passengers actually carried will therefore be critical.
In this next phase of global aviation growth, airports that align expansion with resilient demand, adaptable airline partners and realistic infrastructure timelines will pull ahead.
Those that do not may find that adding seats is the easy part. Filling them profitably is not.