

Airports: Istanbul closes in on rejoining the 100 million annual air passengers by city club

Istanbul has grown inexorably as a tourist destination, a business hub and an international and intercontinental transfer point. The two airports serving Istanbul, Türkiye’s largest city and the country's economic, cultural, and historic centre, collectively hosted 78.6 million passengers in the nine months ended 30-Sep-2023, which was an increase of 17.8% year-on-year. The total at the primary Istanbul Airport (IST), on the city’s western (European) side and which replaced Atatürk Airport in 2019, was 58.0 million (+21.7% year-on-year), while at the Sabiha Gökçen Airport (SAW) on the eastern (Asian) side the growth level was +22.7% year-on-year, to 27.7 million. Accordingly, Istanbul is about to pass the 100 million passenger figure again in 2023 as measured by those using its two airports on either side of the city. The two complement each other well, in the way of catering to the demands of widely differing passengers and their needs. The 100mppa club is a select one – only 11 cities are known to have been members, and there will be fewer than that in 2023.
Summary
- Istanbul’s airports keep on growing. The city will probably put through more than 100 million passengers in 2023, and not for the first time.
- The city's two airports (Istanbul Airport [IST]and Sabiha Gökçen International Airport [SAW]) complement each other, catering mainly to full service O&D and transfer passengers and low cost O&D passengers respectively.
- Istanbul will be rejoining a select club of cities in Asia, Europe, and North America that handle 100mppa, or have done in the past.
- The 100mppa club comprises Atlanta, Bangkok, Beijing, Chicago, Istanbul, London, Los Angeles, Moscow, New York, Paris and Tokyo. Not all will remain members in 2023... Dubai could join too.
Istanbul airports have experienced strong passenger growth throughout this century
The two airports serving Istanbul, Türkiye’s largest city and the country's economic, cultural, and historic centre, collectively hosted 78.6 million passengers in the nine months ended 30-Sep-2023, which was an increase of 17.8% year-on-year.
The total at the primary Istanbul Airport (IST), on the city’s western (European) side and which replaced Atatürk Airport in 2019, was 58.0 million (+21.7% year-on-year), while at the Sabiha Gökçen Airport (SAW) on the eastern (Asian) side the growth level was +22.7% year-on-year, to 27.7 million.
All three of these airports reported consistent and high levels of passenger growth throughout the 21st century, and especially SAW, which in the 11-year period between 2009 and 2019 recorded growth in every year, reaching 72% in 2010. The lowest increase was 4.2% (2019) and was in double digits for seven of those 11 years – one of the most impressive growth records in Europe.
Istanbul Sabiha Gökçen Airport: annual traffic, passenger numbers/growth, 2009-2023
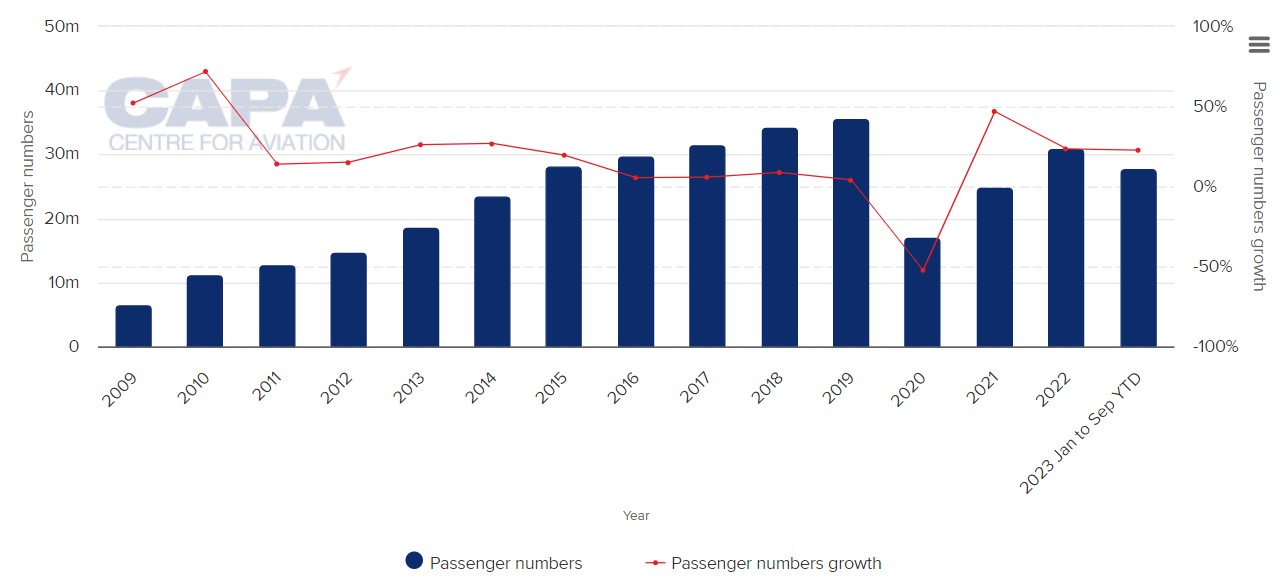
Source: CAPA - Centre for Aviation and General Directorate of State Airports Authority (DHMI, Türkiye)
Passenger traffic growth had been impressive at the old Atatürk Airport as well, reaching +20.6% in 2012, although overall growth did not reach the same levels as at SAW and there was a single year of ‘negative growth’ (-1.5%) in 2016.
The new Istanbul Airport opened part way through 2019, but was then pitched straight into the COVID-19 pandemic in 2020. Since then it has recorded growth, averaging 52% (2021/2022/Jan-Aug-2023).
Traffic at both the existing airports comprises point-to-point (O&D) and transfer traffic, with transfers a more significant part of activities at IST, which is the home base of Turkish Airlines.
Total passenger numbers could amount to 116 million in 2023
If those rates of growth are sustained throughout the remainder of 2023, that would suggest that IST will end 2023 with 78,480,000 passengers and SAW with 37,750,000, to a total of 116,230,000 – the highest ever achieved collectively by two Istanbul airports.
That would easily put the city back into the ‘100 million passengers per annum’ club. That is a term first coined by CAPA - Centre for Aviation in 2015 to identify those cities globally where a single commercial airport or combination of them totals over 100 million in any one year.
It would not be the first time Istanbul has achieved that status, which is afforded to a small number of cities worldwide, as detailed later.
The city managed 102.1 million passengers in 2018, the first time the 100mppa barrier was breached, and then 103.6 million in 2019, with traffic being split between three airports.
Then the numbers took a dive in the two main pandemic years of 2020 and 2021, to 40 million and 62 million respectively, before recovering to 95.3 million in 2022.
Looking at each of the two airports individually, IST’s growth in 1Q2023 to 3Q2023 was greater in the international segment (+23.7%) than in the domestic one (+16%). This was expected, since international traffic continued to grow generally ‘post-COVID-19’.
However, although domestic cargo tonnage grew by 10%, international tonnage reduced by -3%, leaving an overall downturn of -1.9%.
Aircraft movements were up by 21.9% overall, with the increase in the international segment slightly ahead of that of the domestic one.
Some signs that the propensity for ‘revenge travel’ is reducing
Overall capacity is presently (week commencing 23-Oct-2023) 12.2% higher than it was in the corresponding week of 2019, although the difference has been higher than that earlier in 2023, and also during the summer and autumn of 2022. The slowdown may be brought about by the weakening of the ‘revenge travel’ philosophy that is apparent in many other countries, added to concerns about the economy and worsening world tensions generally.
IST is predominantly an international airport (79.0% of capacity), and the leading airline by a large margin, using the capacity measure, is Turkish Airlines, with 79.9%. This predominance rises to 98.9% on domestic flights – as close to a monopoly as any airline of its stature achieves.
Indigenous airlines account for 80.1% of capacity with only 19.9% taken up by foreign ones.
Istanbul Airport (IST): total system seats, all business models, week commencing 23-Oct-2023

Source: CAPA - Centre for Aviation and OAG
IST is a full service airport
IST is very much a full service airport, with 95.7% of capacity in that category, and low cost at just 3.2%.
As CAPA - Centre for Aviation has observed in the past, IST is set up as much as a transfer airport – at which Turkish Airlines excels, with its network of sixth freedom routes. Only 13.3% of capacity is on unaligned airlines.
The route network map below demonstrates IST’s global scope.
A recent CAPA - Centre for Aviation report – OAG’s Megahubs – Heathrow best connected, Kuala Lumpur makes appearance, Dubai is missing – identified IST as the seventh most internationally connected airport in an OAG survey, with Australasia the only unconnected region.
Istanbul Airport: network map for the week commencing 23-Oct-2023
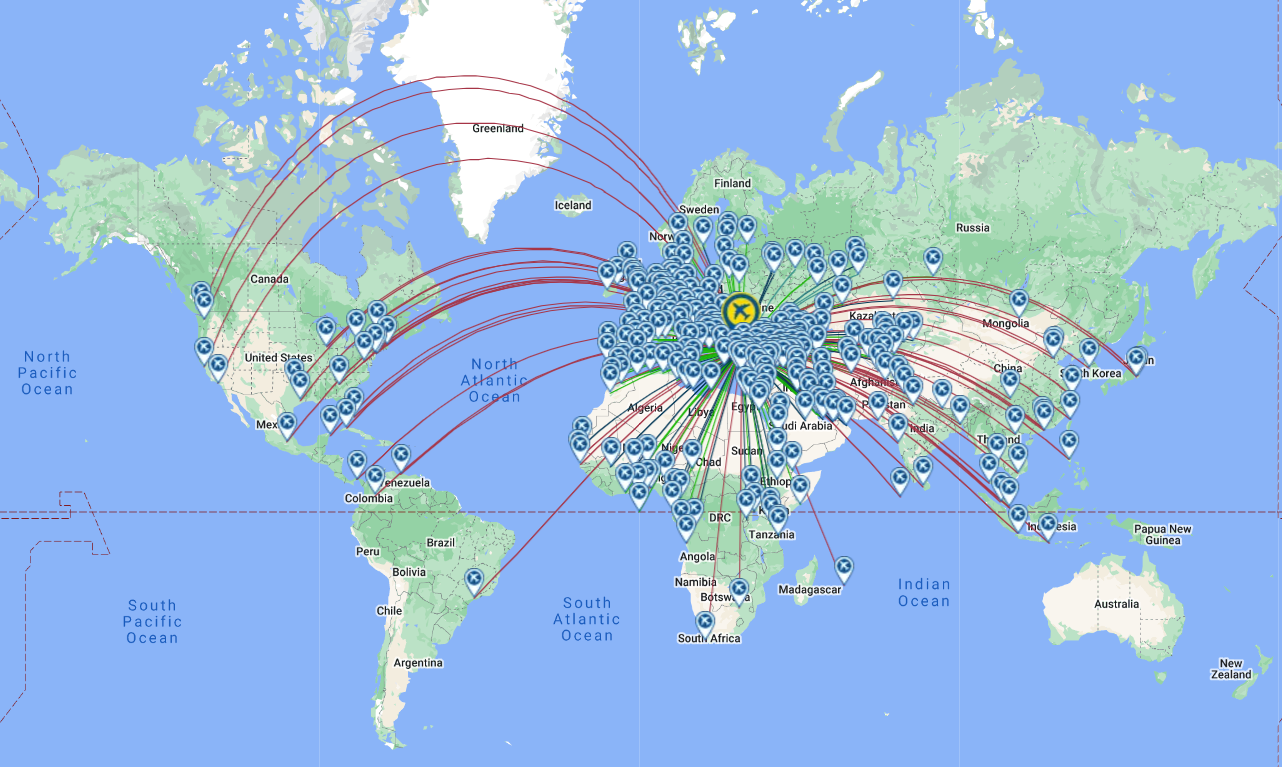
Source: CAPA - Centre for Aviation and OAG
SAW is more local-travel-oriented, with an emphasis on low cost
The Sabiha Gökçen Airport (SAW) is a different beast, even if some of the metrics in the performance statistics for 1Q2023 to 3Q2023 were similar to those of IST.
In that period international passenger growth (+29.8%) again exceeded domestic growth (+15.9%), as did aircraft movements (+18.7% vs. +9.4% domestic).
Cargo tonnage increased in both segments, to +10.8% overall.
The differences between SAW, by comparison with IST, include greater equality between international (55.0%) and domestic (45.0%) capacity, and an even smaller ratio of seats apportioned to foreign airlines (4.4%).
That means that Pegasus Airlines is the main airline, with 66.9% of capacity, but Turkish Airlines has 28.7%, leaving less than 5% for other airlines.
Overall, low cost accounts for almost 69.3% of capacity, compared to 3.2% at IST, and 70.6% is on unaligned airlines, whereas the figure at IST is 13.3%.
The route network at SAW is depicted in the chart below.
Istanbul Sabiha Gökçen Airport (SAW): network map for the week commencing 23-Oct-2023
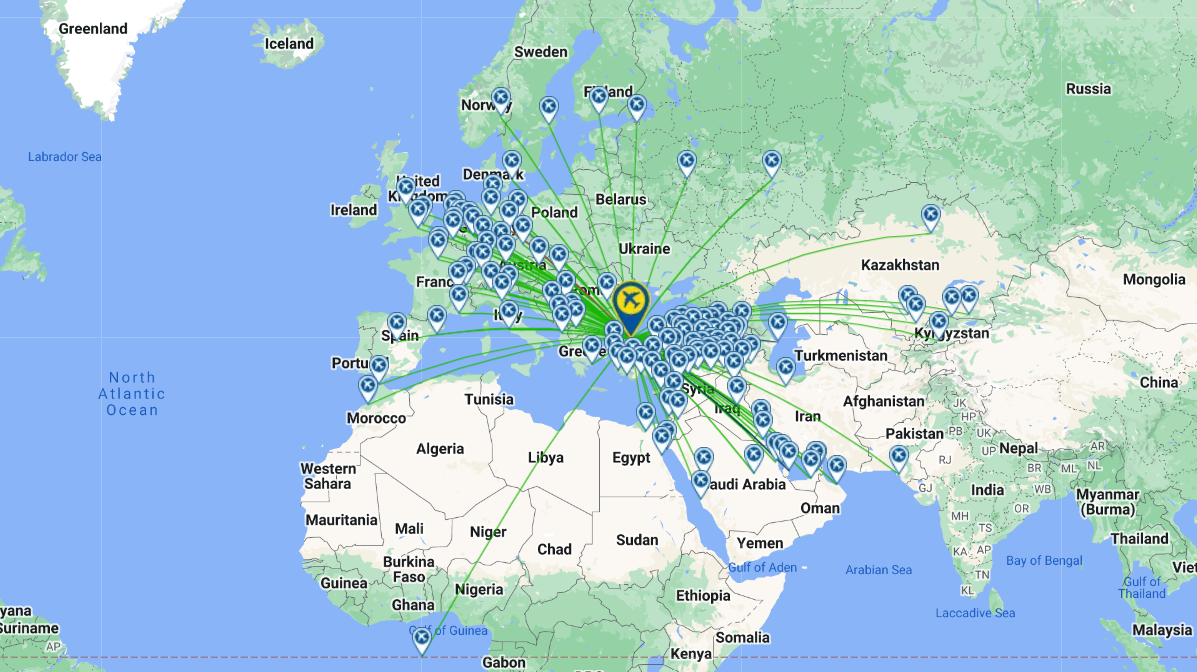
Source: CAPA - Centre for Aviation and OAG
So the two are differentiated by IST being the long-haul-oriented, transit, airport that attracts full service and international airlines, whereas SAW is built around a smaller and more local route and airline base, and is more focused on budget travel.
They jointly offer, even though they are separately owned, a comprehensive Batman & Robin-like duo. Each has its own niche market, but holistically satisfies the full range of travel needs across the indigenous population and a wider external international one. And they do it more rationally than, say, London, the world’s most interconnected city (which has six commercial airports), Los Angeles (which has five), and New York (three).
Istanbul is one of few cities yet to have reached the 100 million air passenger per annum club
Previously it was mentioned that Istanbul is one of a small number of cities to have been a member of the 100mppa club, as well as being about to become one again.
The table below is of other cities which either hold that title now, have done in the past, or which are likely to in 2023, based on growth rates so far (mainly Jan-2023 to Aug-2023).
Comparison of cities and their airports that hold the "100mppa" title, passenger numbers, and the year that the title was achieved
|
City and airports |
Passenger numbers anticipated in calendar year 2023, based on growth rate in first eight months of 2023 |
Year in which 100mppa first achieved |
|
(Capital & Daxing) |
52,685,000 |
2018 (Capital alone) |
|
London |
177,500,000 |
Pre-2009 |
|
(Charles de Gaulle, Orly, Beauvais) |
105,159,650 |
2016 |
|
New York (JF Kennedy, LaGuardia, Newark Liberty) |
148,641,164 |
Pre-2008 |
|
98,061,253 |
2016 |
|
|
Los Angeles (International, Long Beach, John Wayne Orange County, Hollywood-Burbank, Ontario) |
104,712,698 |
2016 |
|
Tokyo |
111,417,436 |
2013 |
|
(International, Al Maktoum) * |
105,579,860 |
- |
|
(Hartsfield) |
105,786,543 |
2015 |
|
Moscow |
No figure calculable for lack of accurate data |
2019 |
|
63,009,000 |
2017 |
Data Source: CAPA - Centre for Aviation Airport Profiles
*The figure for Dubai is highly speculative as, unlike other examples here, it is based on very high growth rates between Q1 and Q2 2023
Alternative figures have 41.6 million passengers reported in 1H2023, suggesting that Dubai will fall considerably short of 100 million in 2023. The closest it has ever come is 89.1 million in 2018
No figures are available for the Al Maktoum airport after 2019, when it reached 1.6 million passengers in that year.