



International tourism has not stopped growing, but that growth is 'fragile'

A global tourism market that adds 3 million international travellers in six months might ordinarily be considered healthy. In 2026, it is better understood as a warning.
The latest UN Tourism World Tourism Barometer records just 0.4% growth in international arrivals in 1H2026, to an estimated 690 million.
The headline disguises a pronounced deterioration in momentum: arrivals grew 2% in 1Q2026 before falling 1% in 2Q2026, with a 3% decline in Apr-2026 and another 3% in Jun-2026.
The Middle East conflict, volatile oil prices, inflation, disrupted air connectivity and higher travel costs have not stopped people travelling. They have made them more selective about where, how far and at what price.
The geographical dispersion is equally revealing. Europe grew 3%, Africa 4% and the Americas 2%, while Middle East arrivals collapsed 22%. Asia Pacific managed only 1% growth and remains 11% below 2019 levels.
For aviation, the message is sharper still. International RPKs grew by exactly 0.4%, while international capacity fell 0.6%.
This is not a market in which airlines can safely assume that tourism growth will translate into broad-based capacity growth. Demand is moving between markets, not simply increasing everywhere.
The next phase of aviation growth will be determined less by the size of the global tourism market than by an airline's ability to identify where that demand is actually going.
Summary
- Global international tourist arrivals grew only 0.4% in 1H2026 to about 690 million, signalling stagnation rather than a robust rebound.
- Momentum weakened sharply, with arrivals up 2% in 1Q2026 but down 1% in 2Q2026 amid monthly declines in Apr-2026 and Jun-2026.
- Regional performance diverged: Europe (+3%), Africa (+4%) and the Americas (+2%) grew while the Middle East collapsed (-22%) and Asia Pacific rose just 1% and remains below 2019.
- Geopolitical disruption, oil-price volatility, inflation and higher travel costs are pushing travellers to be more selective, often shifting to closer-to-home or better-value itineraries.
- For aviation, demand and supply are misaligned: international RPKs rose 0.4% while international capacity (ASKs) fell 0.6%, heavily influenced by Middle East capacity cuts.
- The key airline planning takeaway is that “global growth” masks major traffic redistribution, making network flexibility and rapid capacity redeployment more important than overall scale.
The 690 million question?
There is something almost reassuring about the first number in the latest UN Tourism Barometer: 690 million international tourists travelled during the first six months of 2026, around 3 million more than in H1 2025.
Then look underneath it.
Global arrivals grew 2% in 1Q2026 but contracted 1% in 2Q2026. Apr-2026 fell 3%, partly because Easter occurred in March rather than April, but also as the consequences of the Middle East conflict spread through aviation and travel markets. Jun-2026 brought another 3% decline.
So the market is growing, but it is not gathering momentum. That distinction should matter more to aviation planners than the positive annual headline. Tourism demand has survived a succession of shocks, but its sensitivity to those shocks has increased. The global market can still expand while individual regions, routes and airlines experience materially different conditions.
International tourist arrivals, % change over previous year (* provisional data)
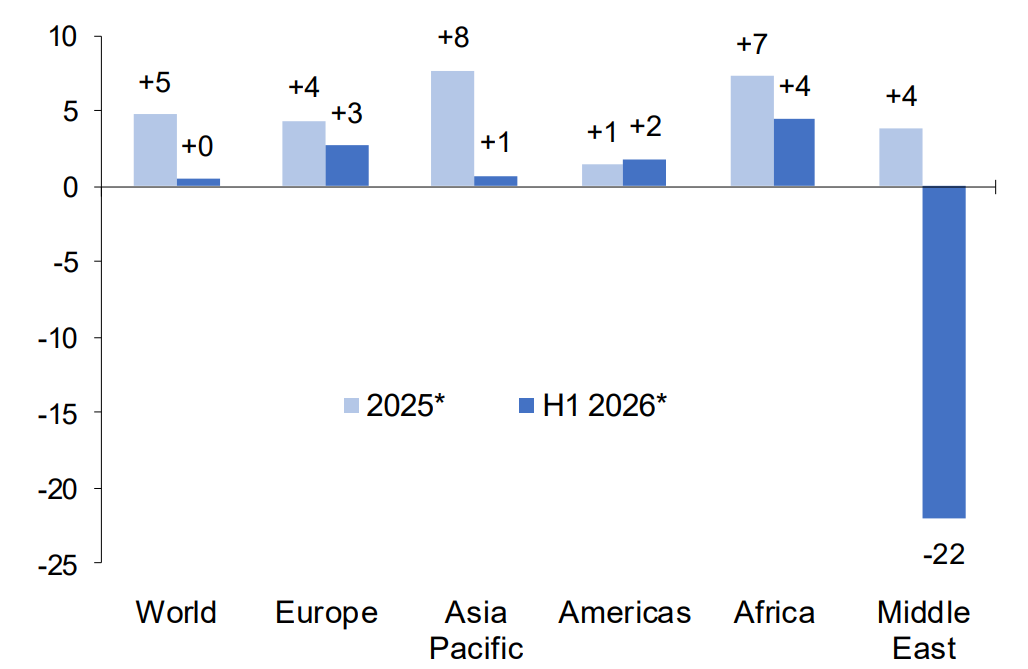
Source: UN Tourism, Sep-2026.
UN Tourism's own description is telling: the sector is "absorbing real pressure and finding a way forward", but "that growth is fragile".
The numbers support the first half of that assessment. They also make the second half difficult to ignore.
Europe is growing, but not uniformly
Europe remains the centre of gravity of international tourism, receiving almost 350 million visitors in 1H2026, 3% more than a year earlier.
But even Europe's growth is highly differentiated. Southern and Mediterranean Europe increased 4%, Central and Eastern Europe also grew 4% and Northern Europe added 3%. Western Europe, by contrast, declined 1%. Greece and Ireland each recorded 15% growth in arrivals.
This is not simply a European growth story. It is a story about traffic being redistributed.
Some Mediterranean destinations benefited from flows displaced from the Middle East. That matters because a redirected traveller is not necessarily incremental demand. The global tourism pool may be broadly stable while the location of its spending changes substantially.
For airlines, that distinction is commercially important. A destination gaining 10% because another market has become inaccessible is not equivalent to a destination generating 10% new demand. The aircraft still has to be moved, the schedule still has to be built and the additional seat capacity still has to be monetised.
Tourism geography is becoming more fluid just as aviation economics remain stubbornly fixed.
Africa is demonstrating the value of alternative geography
Africa recorded the strongest regional growth, with international arrivals up 4%. Sub-Saharan Africa rose 6%, North Africa 3%, while South Africa increased 12% and Morocco 6%.
Yet the same connectivity problem appears.
Some Indian Ocean destinations suffered from reduced air capacity operated by Middle Eastern carriers. Mauritius managed 1% growth across 1H2026 but fell 4% in 2Q2026. Seychelles was down 14% for the half-year, including a 20% decline in 2Q2026.
The implication is broader than the performance of individual islands. Attractive tourism demand does not guarantee tourism traffic. Airlines remain the gatekeeper.
When capacity disappears, demand may migrate rather than vanish. But it does not necessarily migrate to the destination that has the best tourism product. It migrates to the destination that remains affordable, accessible and sufficiently attractive.
That makes air connectivity an increasingly important component of destination resilience.
Asia remains the unfinished recovery
Asia Pacific grew only 1% in 1H2026 and remains 11% below 2019 levels. UN Tourism specifically identifies disrupted connectivity, higher airfares and uncertainty as constraints on intra-regional demand.
Again, the regional number conceals substantial variation. North-East Asia grew 3%, with the Republic of Korea up an extraordinary 21%. South-East Asia declined 1% and South Asia fell 5%.
The significance for aviation is considerable. Asia's tourism recovery is not being held back simply because consumers do not want to travel. The price and friction of travelling have become part of the demand equation.
That changes the economics of network development. The question is no longer simply whether a market has a large population or historically strong travel propensity. It is whether the customer still considers the complete journey - fare, connection, travel time and perceived risk - worth paying for.
The Middle East has exposed the fragility
The Middle East is the clearest stress test. International arrivals fell 22% in 1H2026. International air traffic fell 29%, while international capacity contracted around 20%.
Middle Eastern airline traffic was still down 14% year on year in Jun-2026, although that represented a substantial improvement from the 29% decline recorded in May-2026.
The comparison with recent performance makes the reversal more striking. The Middle East had recorded 40% more international arrivals in 2025 than in 2019, the strongest post-pandemic regional recovery.
The shock therefore has not merely removed traffic. It has demonstrated how quickly a highly connected aviation ecosystem can transmit geopolitical disruption into tourism demand, airline schedules and destination performance.
The partial reopening of routes following the May-2026 and early-Jun-2026 ceasefire has already produced an uneven recovery. Hotel occupancy in the Middle East rose from 48% in Mar-2026 and 49% in Apr-2026 to 53% in Jun-2026, but remained well below the 60% recorded a year earlier.
The system can recover quickly. That does not mean it is insulated from another shock.
A global growth number conceals a local capacity problem
The conventional interpretation of resilient tourism is straightforward: people are still travelling, therefore airlines can continue adding capacity.
The 2026 data does not support such a simple conclusion.
International arrivals increased 0.4%. International RPKs increased precisely 0.4%. Yet international ASKs declined 0.6%. The reduction was heavily influenced by the 20% fall in Middle Eastern capacity, but the wider point is that airlines did not need to add global capacity to accommodate the modest increase in international passenger traffic.
This is a fundamentally different operating environment from one in which demand is consistently outpacing supply.
Airlines are increasingly reallocating capacity towards markets where demand remains sufficiently robust and away from those exposed to geopolitical, economic or connectivity shocks. Latin American and Caribbean carriers grew international traffic 10% in 1H2026, while African airlines grew 9%.
The implication is uncomfortable for an industry still digesting large aircraft order books: global tourism growth does not automatically require global airline capacity growth. It requires capacity in the right markets.
The consumer is not leaving aviation; the consumer is editing the itinerary
UN Tourism's expert panel identifies volatile oil prices, inflation, weak economic output and high transport and accommodation costs as the principal categories of challenge for international tourism in 2026.
Oil provides a useful illustration of the problem. WTI rose 68% from USD67 a barrel on 27-Feb-2026 to USD113 on 7-Apr-2026, before falling below USD70 in late Jun-2026 and subsequently returning to around USD80-90 in Jul-2026.
That volatility feeds directly into airline costs and indirectly into consumer behaviour.
The likely response is not that people stop travelling. UN Tourism expects travellers to seek value and increasingly travel closer to home or domestically. That is a much more consequential shift for aviation than a collapse in demand would be.
A cancelled holiday is visible. A traveller quietly substituting a long-haul trip for a short-haul one is not.
Yet millions of such decisions can alter the economics of entire route networks.
Tourism growth is becoming a relocation exercise
The strongest evidence of the emerging shift lies in the geographic extremes.
El Salvador grew 37%, Paraguay 34%, Bhutan 31%, Vanuatu 30%, Palau 29%, Mongolia 27% and the Republic of Korea 21% in 1H2026. At the other end, South Asia fell 5%, South-East Asia 1% and the Middle East 22%.
These are not comparable markets, but together they demonstrate the point: global tourism is increasingly a collection of local demand stories.
For aviation, network breadth therefore becomes less valuable in isolation. What matters is the ability to redeploy capacity between demand pools without destroying yields or creating unsustainable operating complexity.
The winning network is not necessarily the largest. It is the one that can change shape.
Confidence has improved. The forecast has deteriorated
The UN Tourism Confidence Index for Sep-2026 to Dec-2026 stands at 113, up from 105 for May-2026 to Aug-2026. Some 45% of experts expect better or much better tourism performance than in the same period of 2025; 34% expect similar performance and 21% expect worse.
That is cautiously encouraging. But the industry's forecast has moved in the opposite direction.
UN Tourism Confidence Index: World
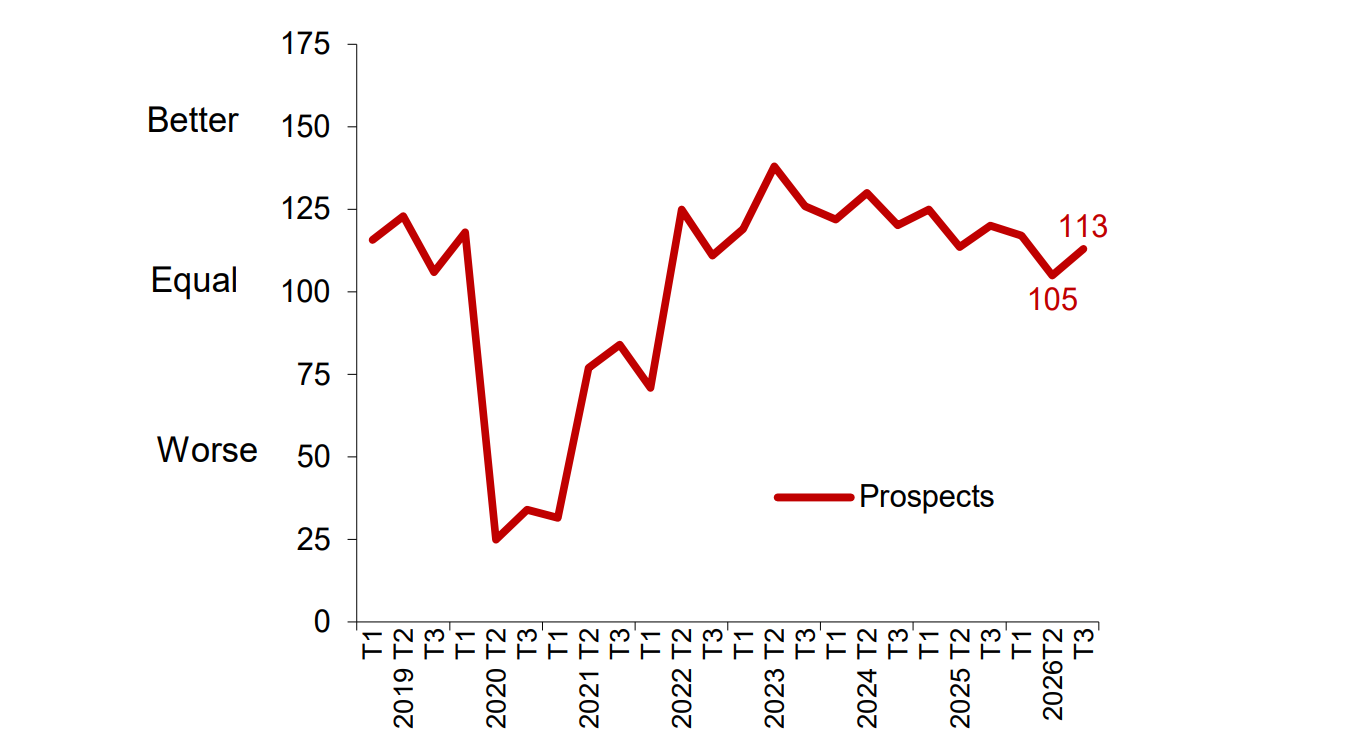
Source: World Tourism Organization (UN Tourism).
T1: January-April; T2: May-August; T3: September-December.
UN Tourism now expects international arrivals to grow only 1%-2% in 2026, compared with its Jan-2026 forecast of 3%-4%. The outcome remains highly dependent on the duration of the Middle East conflict and its impact on oil prices and inflation.
That combination - improved near-term confidence but a lower full-year growth expectation - captures the market unusually well.
The tourism industry is not expecting collapse. It is expecting volatility and that is a much harder environment for aviation to manage.
The danger is not weak tourism, it is misreading where the growth is
The aviation industry should resist the temptation to interpret the 0.4% tourism increase as permission to keep adding capacity on the assumption that global demand will absorb it.
The first-half evidence points elsewhere.
For airlines, this puts network flexibility ahead of sheer network scale. Fleet decisions made on the assumption that every major tourism market will eventually return to its previous growth trajectory are increasingly exposed. An aircraft committed to the wrong geography is not a growth asset; it is an expensive fixed cost.
For airports, the equivalent risk is over-reliance on particular source markets or transfer flows. The 22% decline in Middle Eastern arrivals demonstrates how quickly apparently structural demand can become inaccessible. For destinations, Seychelles' 14% 1H2026 decline, despite its intrinsic tourism appeal, demonstrates the other side of the equation: demand without dependable connectivity is not enough.
The harder conclusion is that aviation should stop treating tourism growth as its demand forecast.
Tourism is becoming more elastic geographically, more sensitive to price and more exposed to disruption. Airlines that plan for the global market will increasingly be disappointed. Airlines that plan for the next destination where travellers choose to spend their money will have the advantage.
By 2027, the most valuable aircraft will not necessarily be the one with the longest range or the highest capacity, but the one that can be moved quickly enough to follow a tourism market that refuses to stand still.